A government scheme may have clear objectives, adequate funding and a well-designed implementation structure, yet still face delays because of fragmented departmental information, weak coordination or limited monitoring of outcomes. For administrators, the challenge is not merely to launch programmes but to identify implementation gaps early and ensure that benefits reach intended communities.
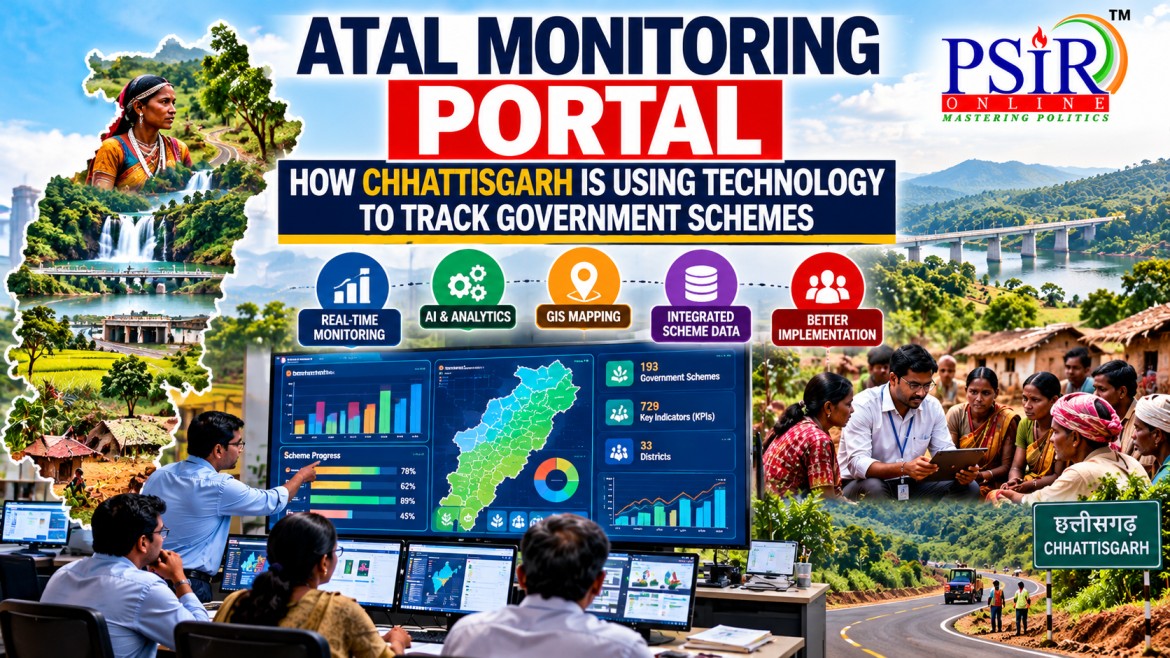
Chhattisgarh is addressing this challenge through the Atal Monitoring Portal (AMP), a digital platform that consolidates information on government schemes and departmental performance. The initiative was highlighted in a NITI Aayog Frontier Tech story updated on 11 June 2026, which described the state's use of Artificial Intelligence (AI), Application Programming Interfaces (APIs) and Geographic Information Systems (GIS) across its e-governance initiatives.
The portal illustrates how technology can support data-driven administration, interdepartmental coordination and evidence-based decision-making. Its broader significance lies in a fundamental governance question: can a common monitoring platform help officials identify problems faster and improve implementation, particularly in remote and tribal districts?
WHAT IS THE ATAL MONITORING PORTAL?
The Atal Monitoring Portal is maintained by the Chhattisgarh Infotech Promotion Society (CHiPS), the state's e-governance agency. It brings scheme-wise information from participating departments into a common digital dashboard, allowing administrators to view implementation indicators at State and district levels.
According to the NITI Aayog-featured case study, the portal covers all 33 districts of Chhattisgarh, 193 government schemes and more than 729 key performance indicators (KPIs). Its coverage includes rural and tribal districts, including areas affected by Left-Wing Extremism.
The system is designed to reduce dependence on scattered departmental reports and make scheme-related information easier to review. Instead of requiring senior officials to collect and compare information from separate sources, a consolidated dashboard allows them to examine multiple indicators in one place.
The portal's significance is therefore not simply that it places government data online. It attempts to create a common monitoring framework through which administrators can review scheme progress, compare performance and identify areas requiring attention.
The case study reports a 40% reduction in data-processing time and a 30% improvement in data accuracy. These are reported results of the featured initiative and should be treated as such: the page carries a disclaimer stating that NITI Aayog does not independently endorse, certify or validate the submitted case study.
HOW DOES THE PORTAL WORK?
The Atal Monitoring Portal brings together data from participating departments through two main channels: API-based data synchronisation and Excel uploads. The information is then processed, checked and presented through interactive visualisations and AI-powered reports on a multilingual interface.
Its main operational features include:
· Data consolidation: Scheme-wise information from participating departments is brought into a common platform.
· Standardisation and validation: Data is processed and checked to improve consistency before being presented.
· Performance indicators: KPIs help administrators assess the progress of schemes and identify indicators requiring attention.
· District-level monitoring: Officials can examine information across administrative levels, including district-level implementation.
· AI-assisted reporting: AI-powered reports can help users interpret the available data and identify patterns that may warrant further examination.
The portal forms part of a wider digital-governance ecosystem in Chhattisgarh. One complementary initiative is Digital Dwaar, a government-to-government data exchange platform developed by CHiPS. It enables authorised departments to share information through approved APIs, with defined purposes and access controls. Digital Dwaar is an internal data-sharing platform rather than a public citizen-service portal.
The distinction matters. Digital Dwaar helps facilitate data exchange, while the Atal Monitoring Portal presents scheme information for administrative review. Together, such systems can reduce manual information exchange and make it easier for departments to work with consistent data.
GIS also has a role in the state's wider digital-governance efforts, particularly in mapping and land-record applications. However, the portal's documented core functions are the consolidation, processing and visualisation of scheme data; it would be inaccurate to suggest that every AMP indicator is necessarily GIS-based.
HOW CAN THE PORTAL IMPROVE GOVERNANCE?
A. Identifying implementation gaps
A dashboard can help officials identify where a scheme is progressing slowly, where indicators are not being reported or where district-level performance differs from expectations. Such information can guide follow-up reviews and the allocation of administrative attention.
For example, if a department reports uneven progress across districts, officials can examine whether the problem concerns staff availability, delayed procurement, incomplete beneficiary records or another implementation constraint. The dashboard can flag the issue, although field verification is still necessary to establish its cause.
B. Strengthening interdepartmental coordination
Many development outcomes depend on several departments working together. Rural livelihoods, nutrition, healthcare and infrastructure may require coordination between district administrations, line departments and local institutions.
A common monitoring platform can provide a shared picture of progress and reduce the time spent reconciling separate reports. When combined with authorised data exchange, it can help departments identify dependencies and coordinate corrective action.
C. Supporting evidence-based decisions
Administrative decisions are more useful when they are based on timely and reliable information rather than only on periodic reports or anecdotal feedback. By presenting indicators in a common format, the portal can support more systematic reviews of implementation.
Nevertheless, a dashboard is a decision-support tool, not a substitute for administrative judgement. Data can identify a problem, but officials must still investigate its causes, consult field staff and determine an appropriate response.
D. Improving attention to remote and tribal districts
The inclusion of remote and tribal areas is important because averages at the State level can conceal local difficulties. A scheme may appear to be progressing well overall while certain districts or communities continue to face access barriers.
District-level monitoring can help officials ask more precise questions about implementation in such areas. Its usefulness, however, depends on whether local data is complete, timely and sufficiently detailed to reflect the realities of communities that are difficult to reach.
ARE SIMILAR MONITORING SYSTEMS USED IN OTHER INDIAN STATES?
Yes. Other states and the Union government use comparable dashboards and data platforms. They differ in their coverage, technologies and administrative purposes, so they should be viewed as related approaches rather than identical versions of the Atal Monitoring Portal.
|
Initiative |
Main purpose and relevance |
|
Maharashtra CM Dashboard |
Provides State leadership with a consolidated view of key schemes, departmental performance and public-service indicators, with drill-down to district and scheme levels. |
|
Odisha State Dashboard |
Uses big-data analytics, visualisation and key performance indicators to support administrative decisions and monitor flagship schemes and major projects. |
|
PRAYAS — National Informatics Centre |
Consolidates indicators from more than 175 schemes and over 1,000 KPIs across 63 departments and ministries, using APIs and data-quality monitoring. |
|
DARPAN — Dashboard for Analytical Review of Projects Across Nation |
Provides a common framework for monitoring departmental activities and projects, including district-level analysis and graphical reporting. |
The Maharashtra CM Dashboard is listed in the Government of India's India Stack Local directory as a web-based monitoring platform that consolidates departmental information and highlights exceptions or underperformance.
Odisha's State Dashboard similarly describes the use of big data, advanced analytics, visualisation and KPIs to support administrative decisions and improve the flow of information from grassroots administration to senior officials.
At the national level, PRAYAS, maintained by the National Informatics Centre, supports performance monitoring across schemes and administrative levels. It uses APIs, data-quality alerts and standardised indicators to facilitate comparisons across departments, States and districts.
DARPAN provides another comparable model for consolidated monitoring and analytical review of departmental projects.
These examples demonstrate that digital dashboards are becoming an important part of public administration. The distinctive feature of Chhattisgarh's case is the reported combination of scheme monitoring across all 33 districts, AI-assisted reporting and a wider State data-sharing ecosystem. The existence of similar platforms elsewhere does not, by itself, establish which system performs better; such a comparison would require comparable evidence on data quality, processing time, corrective action and actual service-delivery outcomes.
CHALLENGES AND THE WAY FORWARD
Digital monitoring can improve administrative visibility, but its effectiveness depends on the quality of the information and the way officials respond to it.
First, data accuracy must remain a priority. Incomplete records, delayed uploads and inconsistent definitions can produce misleading comparisons. Standardised indicators, validation procedures and regular audits are necessary to maintain confidence in the dashboard.
Second, reporting must lead to action. A dashboard may flag poor performance without explaining why it occurred. District officials should investigate the underlying causes, record corrective measures and review whether those measures have worked.
Third, remote areas require reliable data collection. Connectivity constraints, staff shortages and difficult terrain can affect the timeliness of information from tribal and rural districts. Monitoring systems must account for these operational limitations instead of interpreting every reporting gap as poor performance.
Fourth, technology should complement field verification. Administrative data may indicate that a target has been met, but it cannot always establish the quality of the service received by citizens. Field visits, beneficiary feedback, social audits and grievance records remain important.
Finally, AI-generated insights need human scrutiny. Automated reports can help identify patterns, but inaccurate or incomplete inputs may lead to misleading conclusions. Officials should be able to examine the underlying data, understand the limitations and verify important findings before taking consequential decisions.
The next stage of such platforms should focus on measurable outcomes: how quickly problems are resolved, whether scheme benefits reach intended groups, whether data errors decline and whether citizens experience improvements in service delivery. Publishing appropriate evaluation methods and evidence would also help distinguish reported administrative gains from independently verified outcomes.
UPSC ANGLES
|
Dimension |
Relevance for UPSC GS-II |
|
E-governance |
Demonstrates how digital dashboards and APIs can consolidate administrative information and support more timely decision-making. |
|
Government policies and interventions |
Shows how technology can strengthen the monitoring of multiple schemes without replacing their individual implementation frameworks. |
|
Administrative reforms |
Highlights the shift from fragmented, periodic reporting towards integrated and indicator-based performance reviews. |
|
Centre–State relations |
Provides a basis for comparing State-level monitoring platforms with national initiatives such as PRAYAS and DARPAN. |
|
District administration |
Illustrates how district-level indicators can help officials identify implementation gaps and prioritise corrective action. |
|
Tribal and rural development |
Shows the potential of disaggregated data to reveal local gaps that State-wide averages may conceal. |
|
Accountability |
A dashboard can make progress more visible, but effective accountability also requires explanation, field verification and follow-up action. |
|
Transparency |
Better administrative information can support scrutiny, although an internal dashboard does not automatically mean all underlying data is publicly accessible. |
|
Evidence-based policymaking |
Standardised indicators can improve reviews and comparisons, provided the data is reliable and interpreted in context. |
|
Ethics in governance |
Raises questions about accuracy, fairness and the danger of penalising officials or communities on the basis of misleading data. |
|
Artificial Intelligence |
AI-assisted reports can support analysis, but consequential decisions require human judgement and verification. |
|
Institutional capacity |
The effectiveness of digital monitoring depends on trained staff, data standards, connectivity and the ability to act on findings. |
|
Cooperative and competitive federalism |
Comparable monitoring frameworks can help States share practices and learn from different implementation experiences. |
|
Social accountability |
Beneficiary feedback, social audits and grievance data can complement administrative dashboards and reveal problems not captured by KPIs. |
|
Outcome-based governance |
The ultimate measure of success is not the number of indicators tracked but whether implementation and citizen outcomes improve. |
CONCLUSION
The Atal Monitoring Portal illustrates how a State can use digital infrastructure to bring scheme-related information together and support more systematic administrative review. Its reported coverage across Chhattisgarh's 33 districts, 193 schemes and more than 729 KPIs makes it a useful case for examining technology-enabled governance.
Comparable initiatives in Maharashtra and Odisha, along with national platforms such as PRAYAS and DARPAN, show that integrated monitoring is relevant beyond a single State. However, the presence of a dashboard does not automatically guarantee better implementation.
The real test is whether reliable information leads to timely corrective action, stronger coordination and improved public services—particularly for communities in remote and underserved areas. Technology can make governance more informed, but effective governance still depends on capable institutions, accountable officials and meaningful attention to citizens' needs.
OFFICIAL REFERENCES AND FURTHER READING
PRACTICE QUESTIONS